micahlerner.com
Meta’s Next-generation Realtime Monitoring and Analytics Platform
Published February 27, 2023
Found something wrong? Submit a pull request!
Meta’s Next-generation Realtime Monitoring and Analytics Platform
What is the research?
Many companies perform real time analytics in order to customize user experiences or alert on anomalous behavior - other examples from industry include Netflix’s open source Mantis platform or open source projects like Apache BeamDruid, the subject of one such system is the subject of a previous paper review! . Meta performed this function using a system called Scuba, described in published research from VLDB 2013. While the existing system scaled to meet initial demand, over time operational and usability issues led to an internal push to evolve the system.
The newly published research describes the system that came from this work, codenamed Kraken. Unlike Scuba, Kraken optimizes for configurability, allowing users to specify which tradeoffs they want to make around their dataset - for example, faster availability of a dataset can be balanced against the consistency of query resultsTo make this more concrete, user queries in Scuba would go to one of several copies of dataset. Depending on how each deployment of Scuba happened to have ingested the data, repeating the same query, but to different deployments, could return “inconsitent results.” .
The paper provides technical references to the underlying primitives that Kraken is built on - one of which, Shard Manager, was a previous paper review. Beyond describing the architecture of the system, the paper also discusses the experience of replacing the existing system.
Background and Motivation
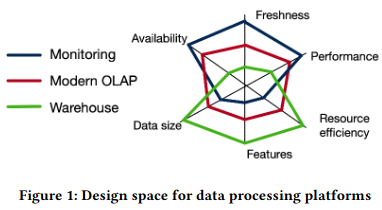
Before diving into the details of the implementation, the paper does a thorough explanation of the design space of systems like Scuba, focusing on six main facets:
- Query performance: how quickly does the system respond to users?
- Freshness: how up to date is the data served by the system?
- Availability: what does the system do under different failure modes? Is data available at all, or can the system return partial results in a degraded state?
- Dataset size: how much data can the system actually store and serve in a performant way?
- Resource efficiency: how much resources (and of what type) does a system require in order to operate? Are the resources used all of the time, or just when responding to queries?
- Features: is the system configurable for different use cases? Does it offer features like backfills and a SQL-like interface?
Different databases weight these facets according to the system’s intended use. The paper focuses on three main categories of tradeoffs:
- Data-warehouses, which store large amounts of data, and are not on the path of a user’s interactive sessionSnowflake, described in a previous paper review, is one such example. .
- Online analytical processing (OLAP) databases, used for analytics and medium-size datasetsThe paper notes that many modern OLAP databases are configurable for specifics use cases - in particular Napa.
- Real-time monitoring systems, which optimize for quickly surfacing up-to-date datasets in as complete a form as possible.
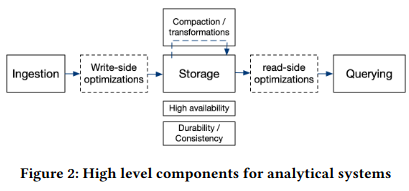
While each category makes fundamentally different tradeoffs, they all have similar high-level components in their read and write paths. For example, databases need to ingest data, and some may implement “write-side optimizations” (like creating different views of the underlying datasetThese are often called materalized views. This article by Materialize also provides helpful context. ). Storage for the underlying dataset is important, although different applications have different availability requirements.
This context is helpful for understanding the why behind Scuba’s design, as well as its potential shortcomings as a real-time monitoring system. For example, the initial system sacrified features like joins in order to support better query performance. It also optimized for the common case and built a single index, improving resource efficiency - at the same time, applications not using that index experienced slower query performance. Lastly, Scuba optimized for durability and availability by designing its engine to return results, even if those results were imperfectThis problem could happen due to machines randomly failing or performing poorly, similar to what is described in The Tail at Scale. .
In contrast, Kraken was designed to make different tradeoffs than Scuba from the outset, specifically focusing on improving user experience and reducing the need for maintenance.
For example, Kraken aimed to provide consistent results to user queries by limiting divergence between copies of a dataset. This approach was unlike Scuba’s, which stored multiple independently-updated copies, each subject to drift from factors like underlying machines going offline - consequently, user queries received significantly varying results depending on the copy they communicated with (even when running the same query).
On the operational complexity front, Kraken aimed to take advantage of automation that would limit complicated manual interventions for operations and scaling. For example, Scuba often required configuration changes to perform updates on underlying hardware. Similarly, insufficient load balancing and load spikes to machines in the system would regularly cause crashes, but scaling resources in response was non-trivial.
What are the paper’s contributions?
The paper makes three main contributions:
- Description of the previous system, characterizing the problem space and motivating improvements.
- Design and implementation of the new system, called Kraken, at scale.
- Evaluation of the system and a description of the migration to it over time.
How does the system work?
Kraken can be broken down into three main components:
- Real-time Ingestion, which covers how the logs make it into the system and become available to query.
- Backup, which allows persistence of the dataset for long periods of time in an optimized format.
- Reads, by which user queries access the stored information.
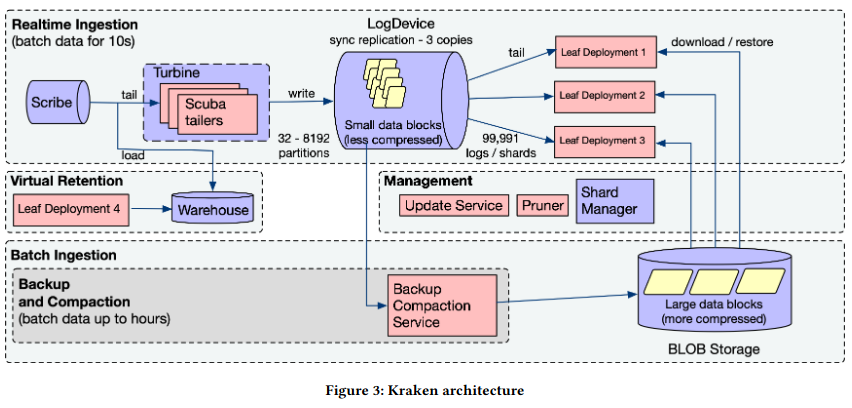
Ingestion
To ingest data, Kraken implements three main components: writing raw logs, reading and operating on the raw logs, and deployment of log data to machines.
Scribe is the first step in ingesting raw logsThere are a few great resources around Scribe, my favorite of which is The History of Logging @ Facebook. There is also a post on Scribe from Meta’s engineering blog here. Scribe appears to at one point have been open source, but is now archived - my assumption is Meta still maintains an internal fork. . Applications log individual entries to a partitioned dataset (called a category), and Scribe notifies downstream systems who are “tailing” the logs.
To reliably read and operate on incoming raw logs at Facebook scale, Kraken uses a distributed framework called TurbineThe original Turbine paper is here. . Turbine schedules “tailer” jobs over many different machines in Meta’s fleet, scaling by adjusting the number of tailers according to load, and rescheduling failed tailers on new machines. The primary job of each tailer job is transforming the logs into a structured and organized format named RowBlocks - the incoming data is not guaranteed to be the same structure as the output dataset surfaced to the user.
Before completing its processing of a RowBlock, a tailer needs to determine which machines should store the final product. This decision is based on two pieces of information about the RowBlock - the input dataset it is associated with, and the partition of the dataset.
The output of this calculation is a ShardId corresponding to the unit of scaling Kraken uses to respond to more requests (sharding is discussed in more detail further down). Kraken then uses the ShardId to write multiple copies of the RowBlock to an ordered, immutable, distributed log system called LogDeviceLogDevice also appears to have been an open source project at one point. on machines spread across Meta’s network.
To make the distributed log available for user queries, machines in the fleet (called leafs) fetch it. Each leaf is assigned shards (a scaling unit representing a specific subcomponent of data) by Shard ManagerMy previous paper review on Shard Manager is here. . To assign shards to leafs, Shard Manager takes into account factors like the load on different parts of a dataset. If a shard is under heavy load, Shard Manager instructs more leaf nodes to maintain a copy of it. Shard Manager also handles data-management tasks, like removing shards of datasets that should no longer be stored (according to a configured retention policy).
Remote Backup and Compaction
New data entering the system is only temporarily stored in the distributed log - the LogDevice is a fixed size, so accepting new entries can only happen if data “ages out” of short-term storage. This eviction implementation poses a problem if users want to query the underlying entries - to solve this, Kraken backs up data using a Backup Compaction Service (BCS).
BCS periodically reads data from the LogDevice, combining multiple blocks, compressing them, and writing the output to a blob storage system. After completing the transfer, BCS creates an entry in the LogDevice. When performing further reads, leafs interpret this entry as an instruction to read previous data from blob storage, rather than from the distributed log.
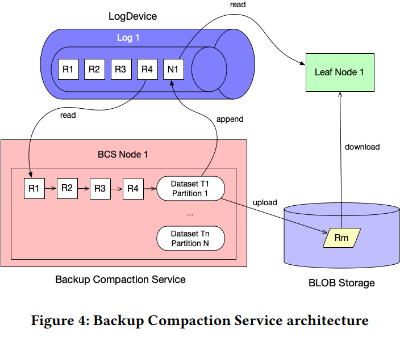
The backup and compaction process increases storage effiency (due to the compression technique), while lowering disk IO (to read the same amount of data, Kraken leaf nodes can perorm fewer disk accesses due to the larger individual size).
Read Path
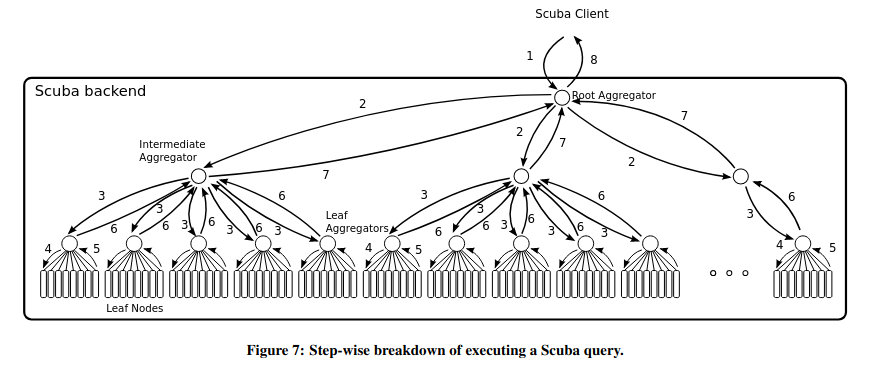
When a user issues a query for data stored in Kraken, a root node executes the query by parallelizing it across relevant machines storing partitions of the data. The paper mentions that this “query architecture is largely retained from legacy Scuba”, and relies on multiple levels of aggregators that fanout requestsThe aggregator pattern also shows up in a previous paper review on Monarch: Google’s Planet-Scale In-Memory Time Series Database. .
When executing the query, Kraken also evaluates whether it needs to access data that is no longer stored in the core system. This “out of retention” data can be stored in other Meta internal systems, but the query interface abstracts this away from the userThis abstraction is similar to those of F1 Query, a system from Google which facilitates querying hetoregenous datasets using the same interface. .
How is the research evaluated?
The paper evaluates the new architecture in two main ways. First, the authors describe Kraken’s productionization, representing whether investments in reliability and ease of use paid off. Second, the research evaluates the performance when launched to users.
Productionaization
The paper talk about migrating from the original system to its new incarnation with minimal impact on users. While independently deploying Kraken code (with no interaction between new and old systems) posed little problem, moving the underlying data and testing performance of the new system was more challenging.
One main performance hurdle that the team faced was switching to a globally-distributed deployment performing cross-region operations. Previously, each region updated its dataset separately (potentially leading to user-facing consistency differences).
An example of this shift was on the ingestion path - previously, Scuba sent new log entries to each region independently and didn’t wait for notification of a successful write. In contrast, Kraken writes of RowBlocks to LogDevices could span multiple regions, and would block on acknowledgement (introducing potential latency). The team addressed this problem by batching writes, amoritizing the latency overhead of cross-region operations.
Ensuring that the underlying data was completely transferred to Kraken was another challenge in the productionization process. To make sure new data was present in both Scuba and Kraken, a single group of tailers began writing data to both systems.
For historical data, the migration was a bit more complicated. Wholesale copying the existing dataset for a Scuba deployment could lead to duplicates if the cutover to Kraken didn’t happen instantaneously - the new tailers would start by writing logs to both Kraken and Scuba, so an entry already in Kraken could be in the Scuba copy of the dataset. Furthermore, turning off writes to Scuba without having Kraken online could lead to data loss. To solve this challenge, the authors labeled data ingested into both Kraken and Scuba. Copying data from a Scuba deployment to Kraken excluded this labeled data (as it was guaranteed to exist in the new system).
Lastly, reliability of Kraken at scale was one concern of switching. To test this, the paper discusses conducting “drain tests” to trigger the system’s rebalancing process (managed by Shard Manager), while monitoring performance and ability to adapt. Additionally, the authors forced failure in different components of the system and watch its recoveryThis is commonly called Chaos Engineering, was popularized by Netflix. .
Experiments
To understand the performance of the new system, the paper considers three main metrics: query latency, ingestion performance, and recovery under failure conditions.
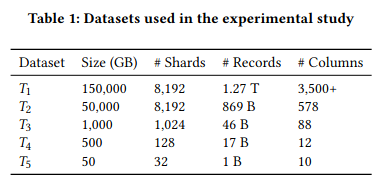
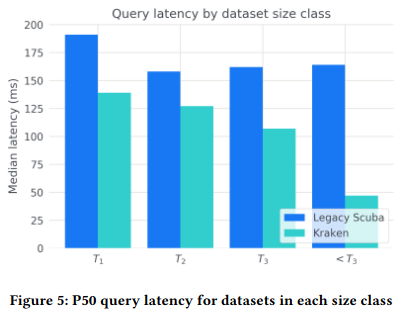
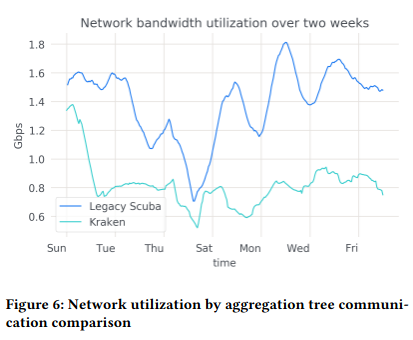
When measuring query latency, the paper considers production datasets of different sizes and characteristics, observing that overall latency decreased between Kraken and Scuba deployments. The authors argue the Kraken’s ability to determine which shards of a dataset are under load (and scale them) is responsible for this effect - unlike Scuba’s design (which doesn’t create a deterministic mapping between data and the machines it lives on), Kraken definitively knows where data is. As a result, it can wait for only those partitions of the dataset to respond when issuing parallelized queries across nodes. Kraken’s reliance on fewer partitions also adds another advantage: aggregating and filtering results from in-scope shards at the edge incurs lower network overhead (as that data doesn’t need to be transferred over the network).
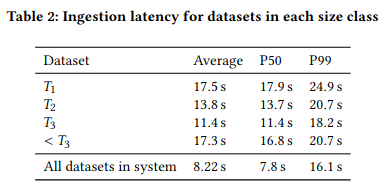
Relative to Scuba, Kraken’s ingestion latency also significantly decreasedFrom my reading, the paper doesn’t attribute any specific factor to lowering ingestion latency. , leading to fresher logs, and a better experience for users (who are relying on up to date information when querying).
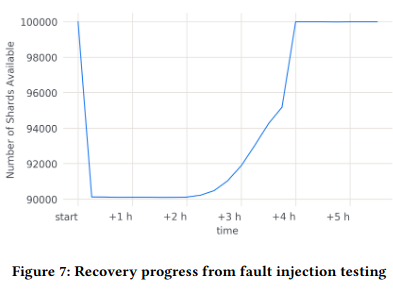
Lastly, the paper measures recovery from failure (in particular targeting leaf nodes), using shard availability as a proxy for recovery (more shards corresponds to a greater share of the logs being available for queries). After eliminating 10% of the shards in a deployment, Kraken is able to recover to the baseline within 3 hours - the paper doesn’t note whether they would be able to decrease this recovery time further (potentially by taking action scaling capacity).
Conclusion
The paper on Kraken contains a useful case study on evolving an existing tool to new demands. The underlying system builds on many Meta-internal pieces of infrastructure (like Shard Manager and LogDevice), and having background context from previous paper reviews, I enjoyed learning how the system was built on top of these primitives - oftentimes papers elide the underlying implementation of the systems they are relying upon, but that is certainly not true in this case.
While Kraken is remarkably similar to existing databases, like DruidDruid was the subject of a previous paper review. , but the research is novel in describing the reasoning behind different tradeoffs (with the added benefit of learning from a previous system deployed internally at scale).